Forest impacts on snow accumulation and melt in a semi-arid mountain environment
 Maggi Kraft
 James P. McNamara
 Hans-Peter Marshall
 Nancy F. Glenn
- Department of Geosciences, Boise State University, Boise, ID, United States
Snowmelt is complex under heterogeneous forest cover due to spatially variable snow surface energy and mass balances and snow accumulation. Forest canopies influence the under-canopy snowpack net total radiation energy balance by enhancing longwave radiation, shading the surface from shortwave radiation, in addition to intercepting snow, and protecting the snow surface from the wind. Despite the importance of predicting snowmelt timing for water resources, there are limited observations of snowmelt timing in heterogeneous forest cover across the Intermountain West. This research seeks to evaluate the processes that control snowmelt timing and magnitude at two paired forested and open sites in semi-arid southern Idaho, USA. Snow accumulation, snowmelt, and snow energy balance components were measured at a marginal snowpack and seasonal snowpack location in the forest, sparse vegetation, forest edge, and open environments. At both locations, the snow disappeared either later in the forest or relatively uniformly in the open and forest. At the upper elevation location, a later peak in maximum snow depth resulted in more variable snow disappearance timing between the open and forest sites with later snow disappearance in the forest. Snow disappearance timing at the marginal snowpack location was controlled by the magnitude and duration of a late season storm increasing snow depth variability and reducing the shortwave radiation energy input. Here, a shorter duration spring storm resulted in more uniform snowmelt in the forest and open. At both locations, the low-density forests shaded the snow surface into the melt period slowing the melt rate in the forest. However, the forest site had less cold content to overcome before melting started, partially canceling out the forest shading effect. Our results highlight the regional similarities and differences of snow surface energy balance controls on the timing and duration of snowmelt.
Introduction
Snowmelt is an important component of the hydrologic cycle for environmental and economic use. The accumulation and melting of snow are impacted by many factors including climate (Molotch et al., 2009; Musselman et al., 2021), vegetation (Dickerson-Lange et al., 2017), and topography (Kormos et al., 2014). Local controlling factors such as the distribution of forested and open areas (Lundquist et al., 2013), aspect (Kormos et al., 2014), and wind (Winstral et al., 2009) can influence snow distribution differently depending on regional climate factors. Developing an understanding of the governing controls on snow accumulation and melt in different hydroclimatic regions is essential to predicting current and future water resources.
Several studies have addressed the different drivers of snow accumulation and melt across climate regions. In warm regions over 20% of the annual snow water resources melt during the accumulation season while in cold regions, <5% of the annual snow water resources mobilize before spring melt (Musselman et al., 2021). The average annual snow accumulation in the region contributes to whether a snowpack will melt or accumulate snow during warm storms. During warm storms, deep low density snowpacks accumulate snow rather than melt snow (Haleakala et al., 2021). Accumulation of Snow Water Equivalent (SWE) at warmer, marginal snowpack locations are governed by temperature while higher, colder locations are more limited by precipitation (Haleakala et al., 2021). Additionally, regional air temperature influences the effect of forest canopy on accumulation and melt. In warmer regions, the magnitude of forest interception tends to be greater than open areas reducing the under canopy snow accumulation (Dickerson-Lange et al., 2021). During the melt period, forest shading in combination with spring temperatures influences whether a region will retain snow in the forest or open longer (Dickerson-Lange et al., 2021; Safa et al., 2021). Several studies demonstrate the regional differences in snow accumulation and melt between forests and open (Dickerson-Lange et al., 2021; Safa et al., 2021) and warm and cold climates (Haleakala et al., 2021; Musselman et al., 2021).
Snow and weather observations are typically made in the open, however in the Western United States two-thirds of the water supply originates from forested environments (Brown et al., 2008; Lundquist et al., 2013). The distribution of forest openings within a forest influence snow accumulation and melt across a landscape, resulting in spatially heterogeneous snow depth and snowmelt timing (Moeser et al., 2014; Mazzotti et al., 2019; Koutantou et al., 2022). Forest openings increase snow water storage retention where vegetation is not intercepting snow, and surrounding vegetation protects these areas from wind and solar radiation (Dickerson-Lange et al., 2017). The structure of forest gaps influences the snow depth with mean snow depths higher when the open fraction is concentrated in larger gaps rather than numerous, fragmented smaller gaps (Mazzotti et al., 2019). Canopy snow interception reduces the sub-canopy snow accumulation, indicating that canopy density is a first-order process in snow accumulation (Roth and Nolin, 2019). Snow that is intercepted by a forest canopy may sublimate, melt, or release onto the surface depending on meteorological conditions, decreasing the snow available to melt and streamflow (Storck et al., 2002). Where wind influences snow accumulation and melt, snow depth is greater and persists longer in the forests compared to non-forested areas (Roth and Nolin, 2019; Hojatimalekshah et al., 2020). Additionally, forest structure alters the snow surface net radiation, impacting snow accumulation and melt (Hardy et al., 2004; Lawler and Link, 2011; Lundquist et al., 2013). Net radiation is enhanced in small gaps or near the forest edge from the contribution of shortwave radiation and longwave radiation (Seyednasrollah and Kumar, 2014; Webster et al., 2016). High emissivity and increased forest temperatures increase longwave radiation from vegetation compared to open areas creating a variable snowpack energy balance in forested environments (Pomeroy et al., 2009; Lundquist et al., 2013). Counteracting increased longwave radiation, forests can shade the snow surface from incoming shortwave radiation, decreasing the incoming shortwave radiation compared to open areas (Malle et al., 2021). At the forest edge shading can vary by edge exposure with north forest edges shading the snow surface (Currier and Lundquist, 2018). These canopy influences on snow processes create uncertainty when estimating the snow surface energy balance and are challenging to represent when simulating snowmelt and ecohydrological processes throughout watersheds.
Understanding when and where snow is accumulating and melting is important for predicting the movement of meltwater in watersheds. Earlier snowmelt is associated with an earlier start of the growing season (Harpold, 2016; Poulos et al., 2021), increased plant transpiration early in the season (Kraft and McNamara, 2022), and reduced streamflow (Hammond et al., 2018; Milly and Dunne, 2020). Peak soil moisture occurs on or within a few days of snow disappearance and declines into the summer season (Smith et al., 2011; Hammond et al., 2019). An earlier start of the soil moisture recession potentially results in greater vegetation water use early in the season but extends the summer plant water stress (Harpold, 2016; Poulos et al., 2021). Elevation is a primary control on snow distribution and the magnitude of snow for streamflow. For example, Rice et al. (2011) found high elevations contributed about one-third of snowmelt to streamflow, while middle elevations contributed 40–60% of annual snowmelt. However, the contribution of snow from different elevations likely varies due to physiographic differences between watersheds. Additionally, the uniformity of the snowpack affects the melt rate and streamflow contribution. In an alpine catchment in Colorado, Badger et al. (2021) indicated a more spatially uniform snowpack melts earlier due to greater energy exposure per unit of SWE, resulting in decreased streamflow. The effects of a more uniform snowpack on decreased streamflow were more sensitive in years with lower mean SWE. This indicates that sites with shallower snowpacks may be more susceptible to changes in streamflow and a more uniform snowpack could reduce soil water availability into the summer months. Due to the spatial variability of snow distribution, knowledge of the watershed scale snow distribution is critical to predicting streamflow for environmental and societal water use. Understanding the processes controlling snow accumulation and snowmelt rate and timing at fine scales is important for improving model predictions of snow water resources (Broxton et al., 2021).
The impact of vegetation on snow cover duration varies in different vegetation types, latitudes, and snow climates (Dickerson-Lange et al., 2021). Snowmelt spatial variability has been explored in maritime climates (Dickerson-Lange et al., 2015; Hubbart et al., 2015; Roth and Nolin, 2017), high Rocky Mountain cold continental climates (Fang and Pomeroy, 2016; DeBeer and Pomeroy, 2017), and the semi-arid southern Rockies (Molotch et al., 2009; Broxton et al., 2015) but, only a few studies have considered snow distribution in an intermountain semi-arid environment.
Previous research on snow distribution in a semi-arid environment highlighted the effects of aspect on snow water inputs (Kormos et al., 2014), rain-on-snow events (Marks et al., 2001), model structure (Havens et al., 2019), and local differences in vegetation (Marks and Winstral, 2001). Relatively little attention has been given to how vegetation and regional differences in climate affect the spatiotemporal variability of snowmelt in the intermountain, semi-arid environment which supplies streamflow for reservoirs and summer water use. In these climates it has been hypothesized that the dominant role of forests is to shade the snow surface rather than intercept snow or enhance longwave radiation (Dickerson-Lange et al., 2021; Safa et al., 2021). However, there are limited studies quantifying the under canopy snow surface energy balance in the cold semi-arid intermountain climates. Dickerson-Lange et al. (2021) highlighted the need for additional research of forest-snow observations in these climates where forest effects can flip from forests shortening to lengthening snow duration.
Within the cold intermountain climate region, snow distribution can range from a marginal (<1 m deep) and intermittent snow cover lasting for 4 months or less to a relatively deep (>2 m) seasonal snowpack, remaining for 8 months out of the year. The variability of snow cover season and depths potentially leads to differences in the sensitivity of the snow surface energy and mass balance within the region (Jennings et al., 2018). Marginal and warm snowpacks, with wintertime temperatures close to 0°C, are more sensitive to a unit increase in snow depth and energy compared to a cold and deep, seasonal snowpacks (Lopez-Moreno et al., 2017; Jennings et al., 2018). The marginal snowpacks produce mid-season snowmelt, begin melting earlier in the spring season, and are more susceptible to rain-on-snow events compared to deep, seasonal snowpacks (Kormos et al., 2014; Bilish et al., 2019). The different snowpack energy states in marginal and seasonal snowpacks highlight the need to evaluate both snowpack states to understand forest-snow processes.
This research evaluates processes controlling snowmelt timing and magnitude in forested, forest edge, sparse vegetation, and open sites at a marginal snowpack and seasonal snowpack location in semi-arid southern Idaho, USA. Specifically, we ask the following question: (1) What are the relative importance of canopy interception, forest-enhanced longwave radiation, and reduced shortwave radiation by shading in snow accumulation and melt in marginal and seasonal snowpacks?
Methods
Study sites
Bull Trout study location
The Bull Trout study location (BT), located in the Bull Trout Lake Watershed in southern Idaho, has instrumentation distributed on the western edge of a flat meadow at an elevation of 2,133 m, and the Banner Summit SNOTEL is 2 km away. The Banner SNOTEL and BT watershed have a seasonal snowpack, receiving an average of 2 m of snow per year with the winter/spring snow cover season lasting from November to early June. The dominant winter (DJFMA) precipitation phase is 61% snow and daily average winter air temperatures range from −19.0 to 6.5°C with an average of −6.0°C. Winter precipitation constitutes about 68% of the annual precipitation. During the study period (snow covered period between October 2019 and June 2021) wind speeds ranged from 0.0 to 3.0 m/s with an average wind speed of 0.7 m/s. The dominant vegetation type includes subalpine fir with an understory of coarse woody shrubs. The mean canopy height at the location is 7.0 m and the Leaf Area Index (LAI) in the forested site is 2.0 m2m−2. To measure LAI and Sky View Factor (SVF), 360-degree photographs using the Ricoh Theta X 360-degree camera were taken below each sensor. Methods for capturing, processing, and changing the images into hemispherical photographs follow Honjo et al. (2019) and the Hemisfer program was used to calculate SVF and LAI above each sensor (Schleppi et al., 2007).
We installed a weather station in the open at the Bull Trout location on 2019-11-23 recording hourly air temperature, relative humidity, incoming and outgoing longwave and shortwave radiation, wind speed and direction, and snow surface temperature. Additionally, the BT study location is 2 km from a SNOTEL station at an elevation of 2,145 m at Banner Summit. The SNOTEL station collects hourly SWE, soil moisture, and temperature at 2.0, 8.0, and 20.0 cm depths below the surface, air temperature, wind speed and direction, and relative humidity. Soils at the SNOTEL station and the BT location are loamy sand (Soil-Survey-Staff, 2013). Average daily air temperatures at the Bull Trout weather stations were biased by 2.8°C and average daily snow depth at the BT location was biased by −2.2 cm compared to the SNOTEL station.
Lower Deer Point study location
The Lower Deer Point study location (LDP), located in the Dry Creek Watershed in southern Idaho, has instrumentation distributed across the southeast aspect of the hillslope at an elevation of 1,585 m (Figure 1). The LDP location has a marginal snowpack, receiving about 1 m of snow per year with a winter snow cover season from December through early April. The dominant winter (DJFM) precipitation phase is 77% snow and daily average winter air temperatures range from −12.0 to 10°C with an average of −2.0°C. Winter precipitation constitutes about 53% of the annual precipitation. During the study period (snow covered period between October 2019 and May 2021) wind speeds ranged from 0.0 to 6.0 m/s with an average wind speed of 2 m/s. The dominant vegetation type includes Douglas fir, Ponderosa pine trees, and an understory of coarse woody shrubs. The mean canopy height at the plot is about 10 m and the LAI is 2 m2m−2.
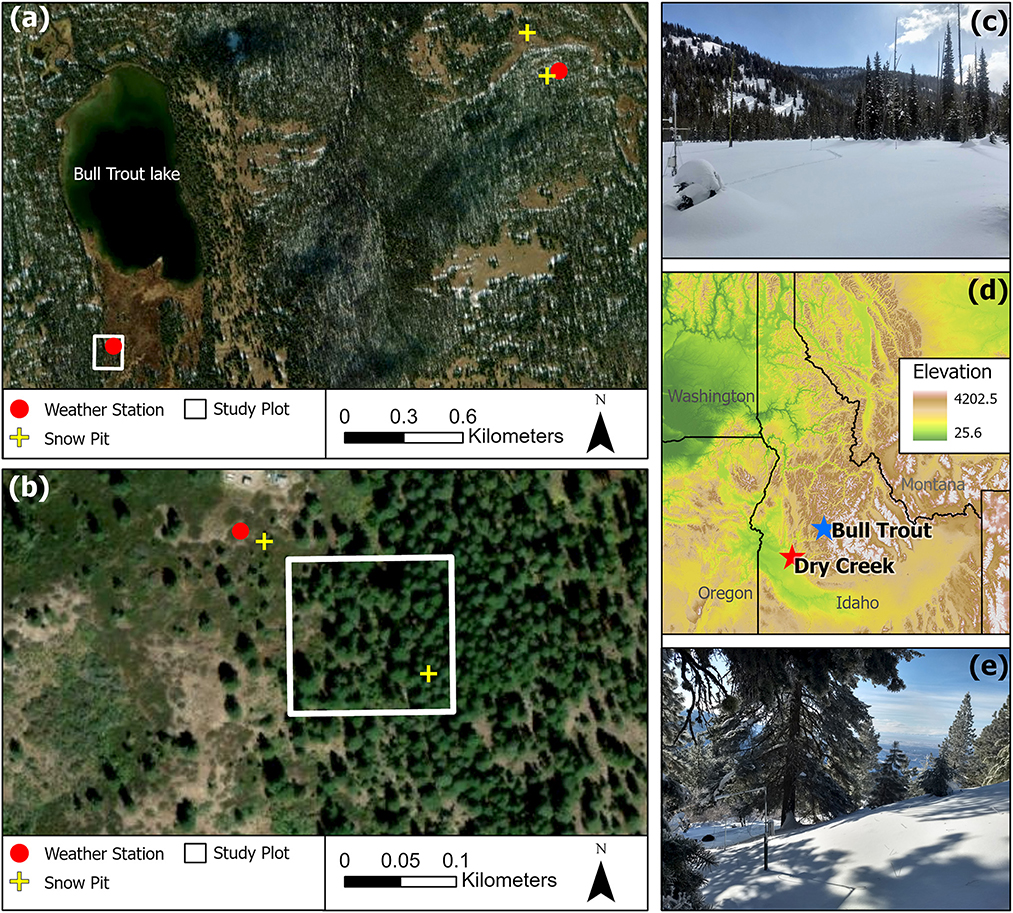
Figure 1. Locations with aerial images (ESRI, 2017) of the Bull Trout (a) and Dry Creek (b) study location in southern Idaho, overview location of the two study sites (d) and pictures of the BT study location looking south east toward the open site (see Figure 2a) (c) and LDP study location looking south toward the sparse vegetation snow depth sensor (see Figure 2b) (e). The white squares represent the location of the snow depth sensor array and radiometer array (LDP only). The red dots are weather station locations, and the yellow crosses are SnowEx snow pit sites.
The LDP location has previously been used to monitor snow accumulation and melt (e.g., Anderson et al., 2014) and is located 0.1 km from a weather station. The weather station is in the open and records hourly measurements of air temperature, precipitation, snow depth, relative humidity, soil moisture, soil temperature, wind speed and direction, and incoming and outgoing longwave and shortwave radiation. However, air temperatures were not recorded due to equipment failure in November 2019. Additionally, soil moisture and temperature are recorded at 2.5, 20, and 33 cm depths adjacent to the weather tower. The soil moisture sensors include Campbell Scientific CS616 Water Content Reflectometers, and soil temperature is measured using thermocouples. The soil at the site is sandy loam, <1 m deep overlying fractured crystalline bedrock, and porosity at the site is ~0.36 (Kelleners et al., 2010; Geroy et al., 2011).
Snow pits and sensors
Five ultrasonic snow depth sensors (Maxbotix) were installed at the BT location and four ultrasonic snow depth sensors were installed at the LDP location. The snow depth sensors were installed across a range of forest structures characteristic of the area (Figure 2). At the BT location sensors were in the forest (SVF 41.5%), south canopy edge (SVF 56.5%), north canopy edge (SVF 70.7%), east canopy edge (SVF 71.9%) and in the open (SVF 97.1%). At LDP the sensors were in the forest (SVF 22.3%), open (SVF 81.4%), on the west canopy edge (SVF 52.4%) and in sparse vegetation (SVF 60.2%). The canopy edge was considered the area between SVF 50% and 75%, while the open was mostly clear of trees (over 75% SVF), and the sparse vegetation had openly spaced trees (about 60% SVF) while the forested sites were in dense forested vegetation (<50% SVF). To distinguish between edge and sparse sensor locations, the edge sensors were in the transition between forest and open areas. While the sparse sensor was in an area with trees spaced far enough apart to where their branches did not touch.
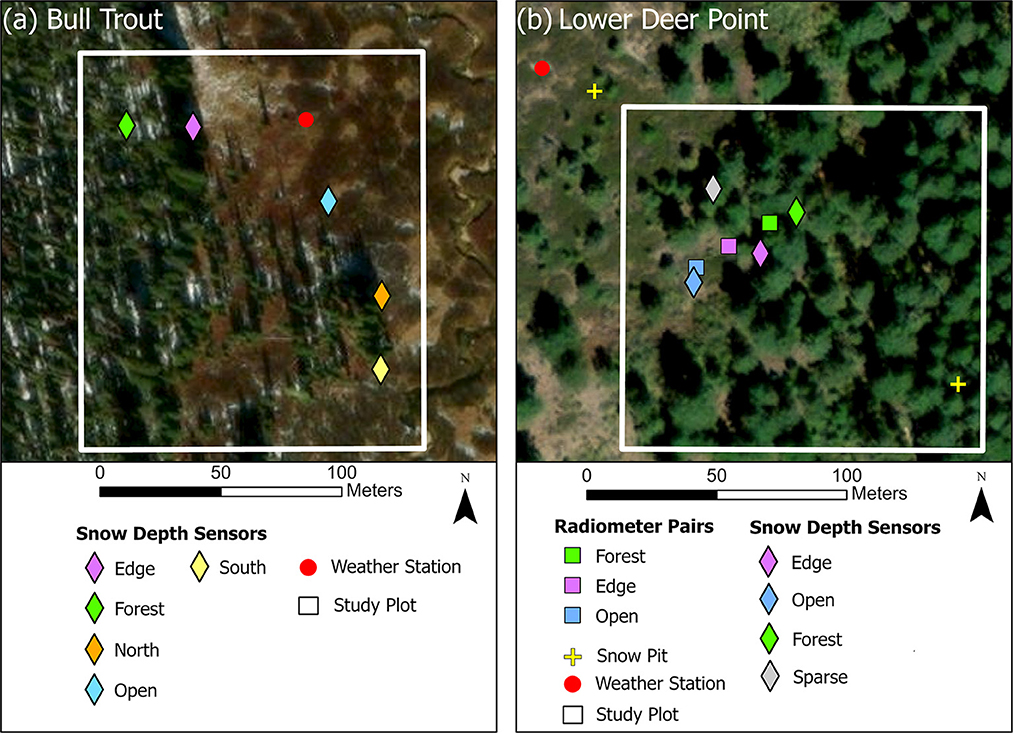
Figure 2. Locations with aerial images (ESRI, 2017) of sensors at the Bull Trout study location (a) and Lower Deer Point study location (b). The white squares correspond to the white squares in Figure 1.
The ultrasonic snow depth sensors' record length was from 2019-11-21 through 2021-05-11 at the LDP location and 2019-10-25 through 2021-06-21 at the BT location recording through water years (WY) 2020 and WY 2021. Gaps in the snow depth sensor datasets were due to battery or equipment failures. The nearby weather station snow depth or other snow depth sensors were used to fill gaps based on a linear regression between the weather station and each sensor. Some gaps were not filled due to weather station failure or during periods of weather patterns when the rate of vegetation interception and accumulation was uncertain. Data gaps consisted of 11.9% of the total observations at BT and filled values consisted of 4.9% of the total observations and 7.0% of the observations remained unfilled. The longest gap filled was for the open and north edge site at BT for 27 days in January 2020. Other data gaps filled were for periods <1 week. Data gaps at the LDP location consisted of 9.9% of the total observations and of these observations 6.5% were filled. The longest data gap filled was for 16 days in January 2020 at the west edge site. An additional 11 snow depth sensors were installed in other vegetation structures but were not included in the analysis due to sensor or battery failure. Daily changes in snow depth were calculated at each sensor, classifying all positive changes in the snow depth as snow accumulation and all negative changes in snow depth as snowmelt.
At LDP weekly to bi-weekly snow pits were surveyed between 2020-01-22 to 2020-03-11 and 2021-01-15 to 2021-03-23, as part of the NASA SnowEx Mission. Through both seasons snow pits were surveyed in the open (elevation 1,852 m) near the weather station and in the forest in a stand of Ponderosa pine trees (elevation 1,809 m) about 120 m from the open site. At the BT location weekly to bi-weekly snow pits were dug at the Banner Summit SNOTEL (2 km from the BT location and referred to as the SNOTEL) between 2019-12-18 to 2020-03-12 and 2021-01-15 to 2021-03-22 and an open site 0.15 km from the SNOTEL site during winter 2020 (also part of the SnowEx Mission). Measurement protocols at both sites follow the NASA SnowEx 2020-21 Experimental Plan (Marshall et al., 2019). Two profiles of snow density were measured every 10.0 cm using a wedge-shaped density cutter. The snow temperature was recorded every 10.0 cm and the snow depth was measured at each side of the snow pit. The snow pit measurements enable the calculation of SWE (Equation 1) and cold content (Ecc) (Equation 2) for each layer:
where ρs and ρw are the density of the snow and liquid water (kg/m3), respectively, dsis the snow depth (m), Ecc is the cold content (W/m2), ci is the specific heat of ice, Ts and Tm are the snow temperature (°C) and melting temperature of snow (0°C), respectively.
Radiometers
In addition to the four-component radiometers at the LDP and BT weather stations, we installed three paired incoming shortwave and longwave radiometers at the LDP study location on 2019-02-24 (Figure 2). The radiometers were distributed on the west exposure of the forest edge, in the open and in the forest. The west exposed forest edge had a SVF of 53%, the radiometer pair in the forest had a SVF of 22% and the open site had a SVF of 80%. We assumed the sensors were covered in snow during or immediately following snowstorms and thus data was removed during snowstorms and an hour after the storm ends. Additionally, we installed timelapse cameras to identify and remove data when the radiometers were snow covered for extended periods of time. Additional data gaps were due to battery or sensor failures. Data gaps in the open sensor were filled using the weather station data. We split the incoming radiation measurements into the accumulation (Dec–Feb) and snowmelt (March–April) periods.
Calculated energy balance components
The snow surface energy balance was calculated at a daily time step using the aggregated hourly weather data from LDP and BT.
Where ΣQ (W/m2) is the net flux of energy per unit area to the snowpack from the atmosphere and ground (W/m2), E is the change in the energy state of the snowpack per unit area (W/m2) and t is a specific duration (s).
The net energy flux is described as
where Qk is the net shortwave radiation (W/m2), QL is the net longwave radiation (W/m2), QE is the latent heat (W/m2), QH is the sensible heat (W/m2), QG is the ground heat flux (W/m2) and QR is the conductive and advective energy fluxes (W/m2). QR is the conductive and advective energy fluxes and assumed to be negligible at both sites. The net longwave and shortwave radiation were directly measured using four-component radiometers at each site. All other terms were calculated using the station weather data. For parameters not recorded at the BT weather station, we used the nearby SNOTEL data.
The change in energy state of the snowpack depends on if the average snowpack temperature is at or below the freezing temperature.
Ecc is the internal energy of the snowpack at a given time, commonly known as the cold content (Equation 2 above). Emeltis the energy associated with phase change (W/m2)
where λf is the latent heat of freezing, and all other variables have previously been defined.
Turbulent flux
The sensible heat exchange was calculated as
where k = 0.4, ρa is the density of air (kg/m3), cpis the heat capacity of air (MJ/kg K), zm is the measurement height above the snow surface (m), zd is the zero-plane displacement height (m), z0 is the surface-roughness height (m), uzm is the wind speed (m/s), Ta is the air temperature (°C) and Tss is the snow surface temperature (°C). We assume that zd is negligibly small, zm is 2 m, and z0 is 0.002 m (Morris, 1989; Dingman, 2015). The snow surface temperature was measured at BT station but estimated at the LDP weather station using the longwave radiation measured at the weather station. We found the outgoing longwave radiation and snow surface temperature to be highly correlated at BT (R2 = 0.99).
where Lout is outgoing longwave radiation, Lin is incoming longwave radiation εss is the snow surface emissivity and is set at 0.98, and σ is the Stefan Boltzmann constant.
The stability state of the air above the snow surface was determined by the dimensionless bulk Richardson number, RiB.
where g is the gravitational acceleration (9.81 m/s2) and all other terms have previously been defined.
The turbulent exchange rates can be adjusted by a stability correction factor in stable and unstable conditions (Andreadis et al., 2009). Positive values of RiB indicate stable conditions where the warm air and cool snow surface impede turbulent mixing. Negative values of RiB indicate unstable conditions where the air is colder than the surface and free convection exists causing increased mixing. We applied Equations 9–11 as the general stability correction equations (Andreadis et al., 2009; Dingman, 2015).
The latent heat exchange was calculated as
where λ is the latent heat of sublimation (MJ/kg), ρw is the density of water (kg/m3), p is atmospheric pressure (kpa), ezm is vapor pressure at the measurement height (kpa), es is the vapor pressure at the snow surface (kpa).
Ground heat
The ground heat was calculated following (Marks et al., 1998).
where kg is the thermal conductivity of the soil (W/m K), (kg = 1.12 W/m K for both sites), ks is the thermal conductivity of the lower snow layer (W/m K), Tg is the soil temperature (°C), Ts is the bottom snow layer thickness (m) and zg is the distance below the ground surface (m), zs is the thickness of the bottom snow layer (m). We used the measured soil temperature from the SNOTEL near BT at 2 cm depth and the soil measurement site next to the LDP weather station at 2.5 cm depth. The ks was estimated as 0.3 W/m K (Gray and Male, 1981) for both sites based on the lower snow layer density of 330 kg/m3. The lower snow layer density was estimated using the average value from the deepest snow density measured in the snow pits. The temperature of the bottom snow layer was estimated using the snow pit temperature profiles and linearly interpolating between each snow pit date. The lower snow pit layer thickness was set at 10 cm.
The measured and calculated energy balance components were split into accumulation and melt periods based on when the energy and mass balances shifted from negative to positive energy flux and the snowpack began to melt. At BT the accumulation period was December through March and the melt period was April through the snow disappearance at the end of June. At LDP, the accumulation period was December through February, and the melt period was March through snow disappearance in April.
Results
Snow depth
Bull Trout
At the seasonal snowpack, BT location peak snow depth ranged from 175 cm (WY 2020) and 208 cm (WY 2021) in the open and 152 cm (WY 2020) to 139 cm (WY 2021) in the forest (Figure 3). The timing of peak snow depth was the same for all vegetation covers occurring in early April (WY 2020) and February (WY 2021) (Table 1). On average, the forested sites accumulated 77% less snow, indicating the forest canopy intercepted 23% of the peak snowfall. In both years snow melted out earliest at the south exposed site and latest from the north exposed site (in WY 2021) or forested (in WY 2020) sites. Snow disappearance ranged from 2020-05-22 to 06-11 (20 days) and 2021-05-13 to 06-03 (21 days) from all sites. However, in WY 2021 all except the north exposed edge site was melted out within 9 days of each other (05-13 to 05-22). The melt rates were lowest in the forest (average 1.6 cm/day since 1 April), highest in the open and south exposed edge sites (average 3.1 cm/day since 1 April), and the east edge site melt rate was closer to the south exposed edge and open sites (average 3.0 cm/day since 1 April). The melt rates at the different sites were similar between the 2 years except for the forest site where the melt rate was 0.7 cm/day slower in WY 2021.
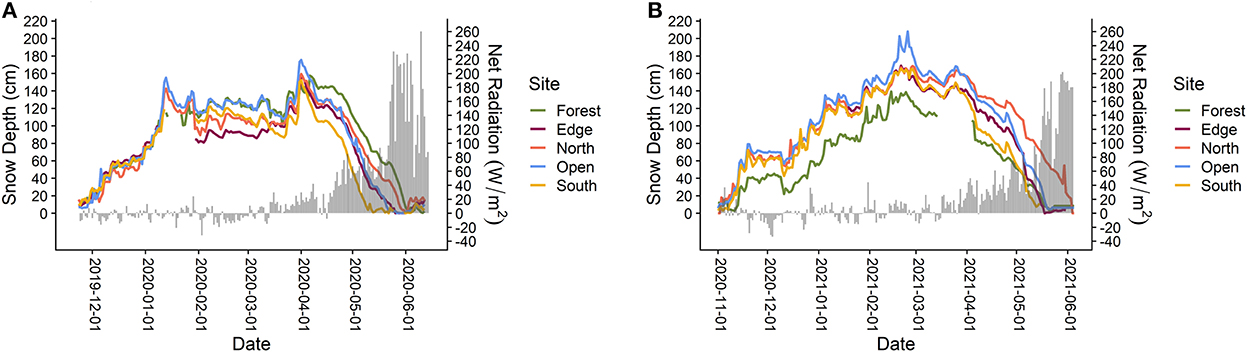
Figure 3. Snow depth with net total radiation at the BT location during winter 2020 (A) and winter 2021 (B). Net total radiation was measured at the weather station located in an open canopy cover site.
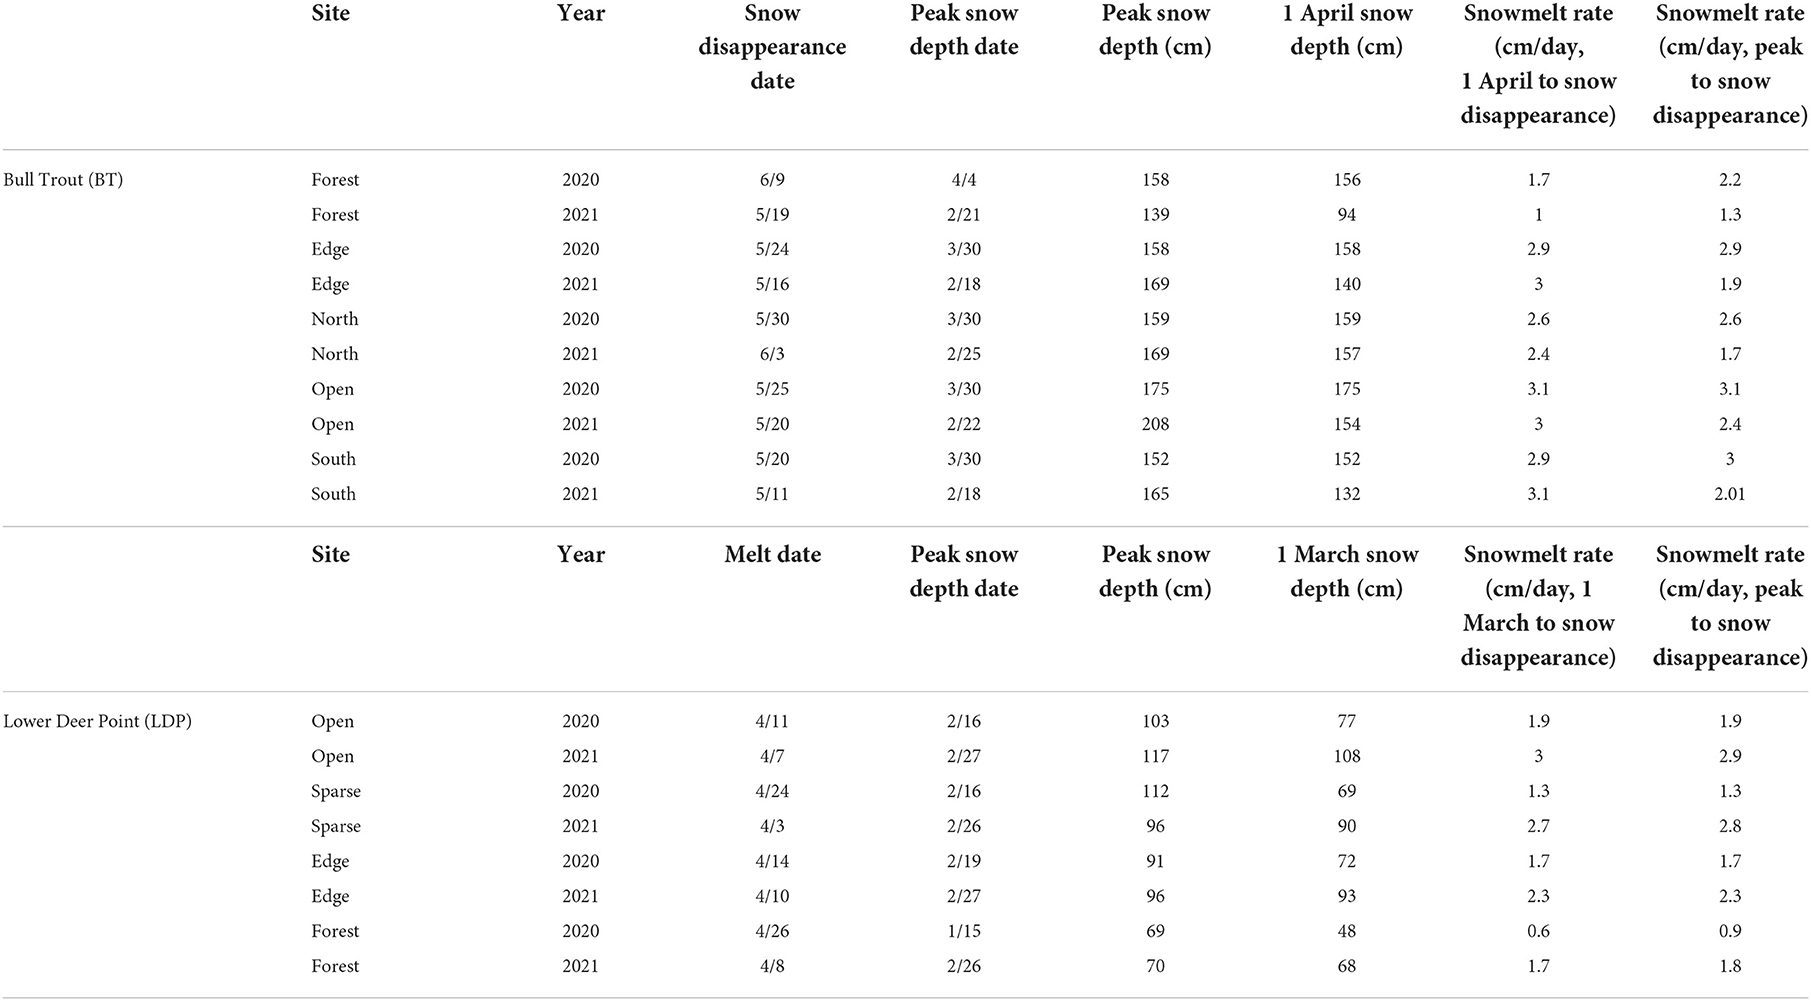
Table 1. Bull Trout and Lower Deer Point snow depth and melt rates and timing.
Lower Deer Point
At the marginal snowpack, LDP location values for peak snow depth ranged from 103 cm (WY 2020) and 117 cm (WY 2021) in the open and 69 cm (WY 2020) and 70 cm (WY 2021) in the forest (Figure 4). On average, the forest accumulated 63% less snow, and the forest canopy intercepted 37% of the snow accumulation. The timing of peak snow depth occurred at the same time for all vegetation covers in mid (WY 2020) to late (WY 2021) February (Table 1). Snow melted latest at the forest (WY 2020) and west edge (WY 2021) sites and earliest at the open (WY 2020) and sparse (WY 2021) sites. In both years snow melted out in the open before the forest site, however, in 2021 the difference was only 1 day. Snow disappearance timing from all sites ranged from a 19 day difference (WY 2020) to a 7 day difference (WY 2021). The snowmelt rate from the snow depth peak to snow disappearance and 1 March to snow disappearance were both faster in all vegetation covers in 2021 with an average melt rate of 2.5 cm/day in 2021 and 1.4 cm/day in 2020. The fastest melt rate was at the open site (average 2.4 cm/day since 1 March) and the slowest melt rate was at the forest site (average 1.4 cm/day since 1 March).
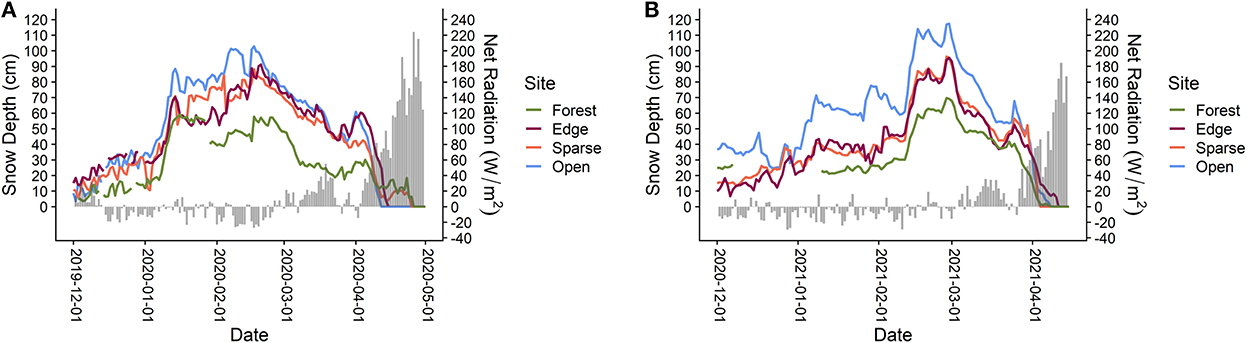
Figure 4. Snow depth with net total radiation at the LDP location during winter 2020 (A) and winter 2021 (B). Net total radiation was measured at the weather station located in an open canopy cover site. Note the axis limits are different compared to Figure 3.
Energy balance
Weather stations
Bull Trout
During the accumulation phase net shortwave and net longwave came close to canceling each other out in both WY 2020 and WY 2021 (Table 2). The turbulent fluxes, sensible and latent energy, were both positive and of similar magnitude in both years. During the accumulation periods in WY 2020 and WY 2021, latent energy contributed 2.4 and 3.4% to net energy, respectively (Equation 3), while sensible energy contributed 10.1 and 14.5% in the same period. During the melt phases, in WY 2020 and WY 2021, the latent heat flux contributed 2.2%, respectively, while the sensible heat flux contributed 5.2 and 5.9% in the same period. The ground energy flux was <2.7% of the total energy flux through the accumulation and melt periods in both years. During the melt period in both years, net shortwave radiation contributed the most to the energy flux (60.3 and 56.5%). The net longwave flux during the melt period in WY 2020 and WY 2021 was 22.7 W/m2 and 38.8 W/m2 lower than the accumulation period. During the melt period, the outgoing longwave radiation was on average 47.8 W/m2 greater than the accumulation period while the incoming longwave radiation was on average 6.0 W/m2 less. The greater outgoing longwave radiation during the melt period led to the lower net longwave flux during the melt periods. Overall, the net energy flux was greater during the melt period in WY 2021 compared to WY 2020 from increased net total radiation, and turbulent fluxes in WY 2021. We expect the energy balance at the open site to be different than the other canopy cover sites. As forest density increases, we would expect the net shortwave radiation to decrease and net longwave radiation component to increase. While the energy balance at the open site is different than the sites with canopy cover, evaluating how the snow surface energy balance changes throughout the season will provide insight into how the snow surface processes change through time.
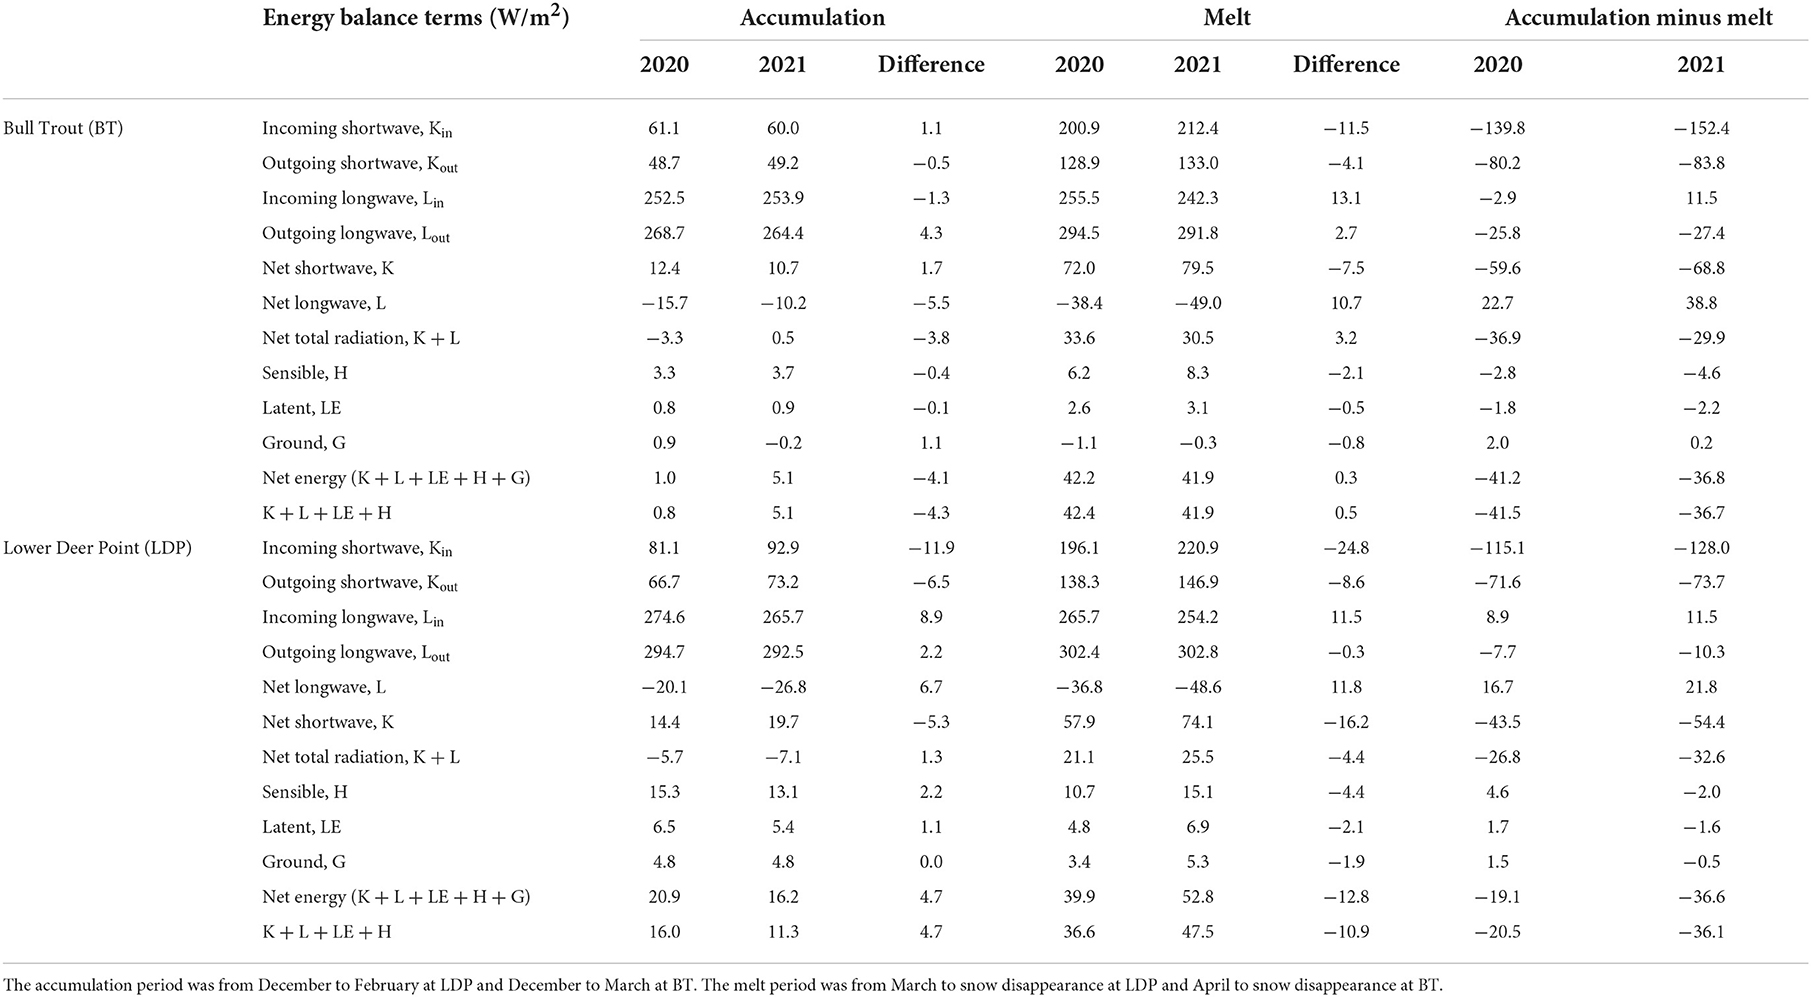
Table 2. Daily average snow surface energy balance at the weather station and SNOTEL for the BT and LDP accumulation and melt periods for each year, the difference between the years (WY 2020–WY 2021) and accumulation and melt periods.
At the BT weather station in the open, November longwave radiation was greater in WY 2021 creating greater net total radiation early in the 2021 winter (Figure 5A). Through December and January, both years had similar radiation values and net total radiation was near zero. The largest difference between years in net total radiation occurred in February when longwave radiation was greater in WY 2021 resulting in higher net total radiation compared to WY 2020 and median positive net total radiation. Through March, April, and May in WY 2021 longwave radiation tended to be lower and both shortwave radiation and net median net total radiation tended to be higher compared to WY 2020.
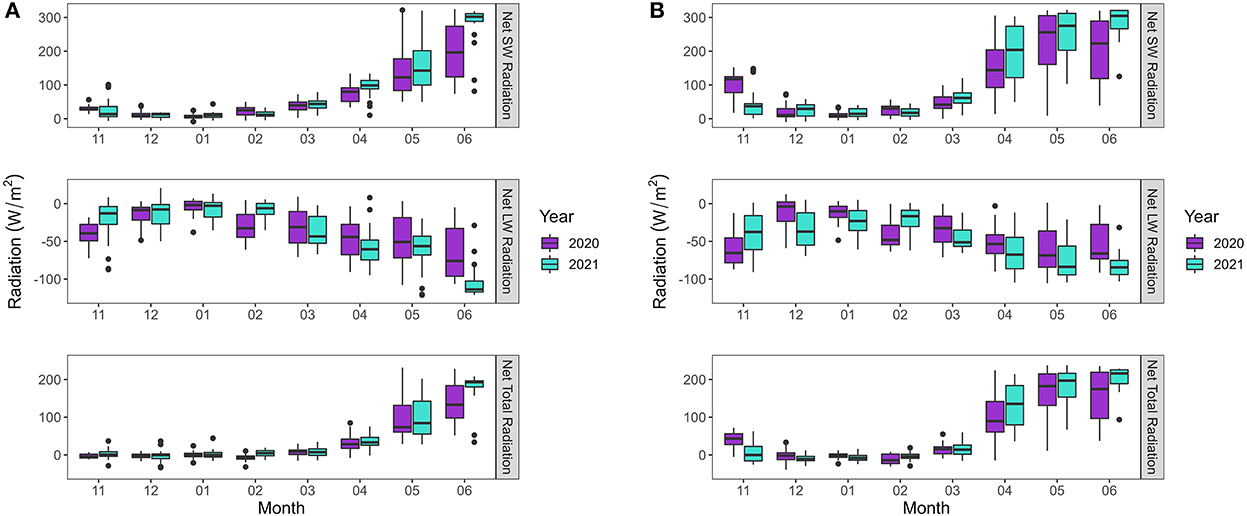
Figure 5. Daily average net longwave (LW), net shortwave (SW) and net total radiation (NR, LW+SW) at the BT (A) and LDP (B) locations for each month and year. All measurements are from the weather station located in open canopy cover sites at each study location.
When comparing the net total radiation at the weather station to the continuous sensor snow depth measurements in the different canopy covers through the accumulation period, the net total radiation varied between positive and negative values. Near 1 April the net total radiation became predominantly positive (Figure 3). In WY 2021 near the end of March the net total radiation was higher compared to WY 2020 resulting in snowmelt before the beginning of April and a lower snow depth on 1 April 2021 (mean snow depth WY 2020 was 160 cm and WY 2021 was 135 cm).
Lower Deer Point
The net energy flux (Equation 3) during the accumulation phase was similar between years (difference of 4.5 W/m2). During the accumulation phase in WY 2020 and WY 2021, the magnitude of the net longwave radiation was greater than the net shortwave radiation, reducing the net energy flux by 5.7 and 7.1 W/m2. In the same accumulation periods, the ground heat flux contributed 7.9 and 6.9% to the net energy flux while the turbulent fluxes contributed a combined 35.6 and 26.4% to the net energy flux. Net longwave was less (6.7 W/m2) and net shortwave was greater (5.3 W/m2) in WY 2021 compared to WY 2020. The net energy flux during the melt phase was greater in WY 2021 than in WY 2020 (a difference of 17.3 W/m2). During the melt period in WY 2020 and WY 2021, net shortwave radiation contributed the most to the net energy flux (51.0 and 49.4%). Consistent with the accumulation period, in the melt period net longwave was less (11.8 W/m2) and net shortwave was greater (16.2 W/m2) in WY 2021 compared to WY 2020. The longwave flux during the melt period was 36 W/m2 lower in both years compared to the accumulation period. During the melt period, the outgoing longwave radiation was on average 26.4 W/m2 greater than the accumulation period while the incoming longwave radiation was on average 1.2 W/m2 greater. The greater outgoing longwave radiation during the melt period led to the lower net longwave flux during the melt periods. The ground heat flux was positive in both years contributing 3.0 and 3.5% to the net energy flux.
At the weather station in the open, November and December net total radiation was greater in WY 2020 compared to WY 2021 (Figure 5). In January, net longwave radiation was lower in WY 2021 reducing the net total radiation. In February the pattern shifted with higher longwave radiation values and median net total radiation in WY 2021. Through March the net radiation was similar, and the median was positive. In March 2021, the net shortwave radiation was greater and net longwave radiation was lower.
When comparing the accumulation period net total radiation at the weather station to the continuous snow depth measurements, net total radiation was predominantly negative and similar to the BT location, becoming positive near 1 March in both years (Figure 4). The positive net total radiation coincided with the start of the snowmelt period. The 1 March snow depth in WY 2021 was 31 cm greater than 1 March 2020 but, net total radiation through the first half of March was greater in WY 2021, resulting in increased snowmelt rates. During the storm near the end of March, energy input was reduced, and snowmelt was delayed for 10 days in WY 2020 and 3 days in WY 2021.
Radiation observations in different forest types at Lower Deer Point
During the accumulation and snow melt periods the average daily incoming shortwave radiation was lowest in the forest (30.5 W/m2) and highest in the open (74 W/m2) (Table 3, Figure 6). However, the average daily incoming longwave radiation was highest in the forest (297 W/m2) and lowest in the open (283 W/m2) (Figure 6). During the accumulation period, total incoming radiation (SW + LW) in WY 2021 was lower at the open and west edge sites than the forest site compared to WY 2020. During the melt period, incoming radiation was higher at all sites in WY 2021 but the open site had the largest difference between years (60.6 W/m2).
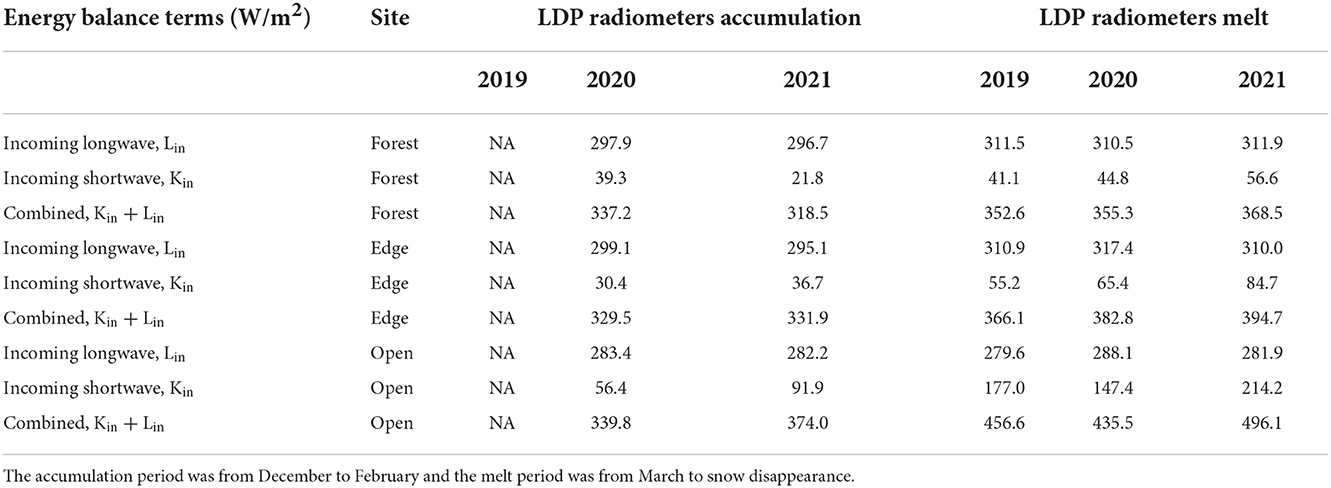
Table 3. Daily average measured incoming shortwave and longwave radiation at the LDP study site split into accumulation and melt periods.
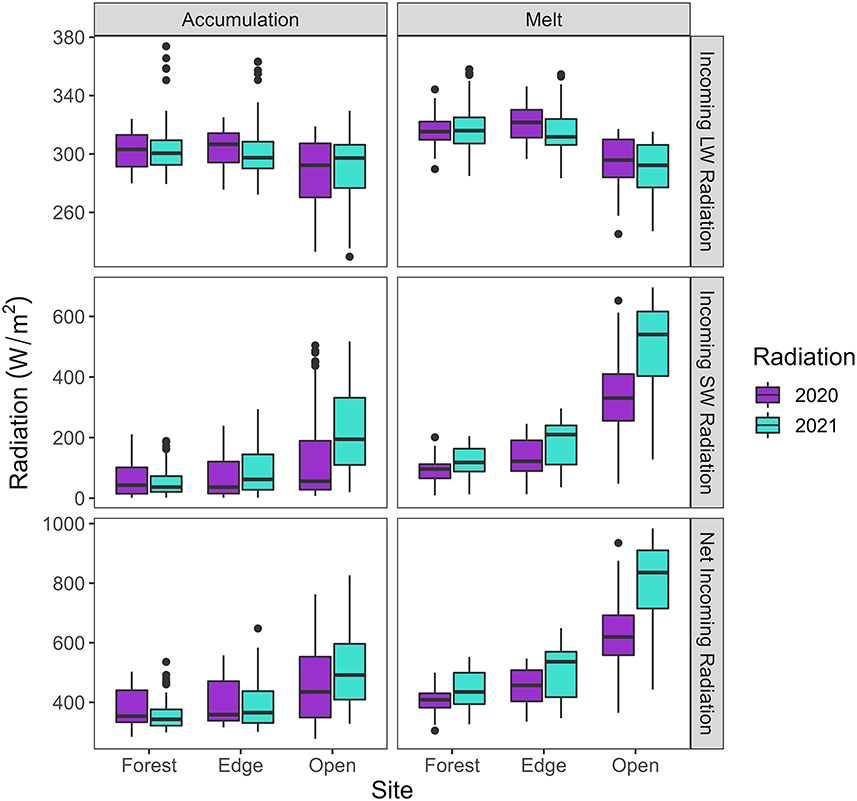
Figure 6. Daily average longwave radiation, incoming shortwave and net incoming radiation for WY 2020 and WY 2021 in the forest, open and edge sites during the accumulation and melt periods at the LDP study location. Daily values were split over the accumulation period from December-February and during the melt period from March—snow disappearance.
Soil moisture and temperatures
The soil temperatures were sensitive to air temperature and snowmelt timing in both years and locations. At the SNOTEL near BT, snow depth was <10 cm in November WY 2020 but >10 cm in November of WY 2021. During November soil temperatures in 2019 were −1.07°C and in 2020 were −0.27°C (Figure 7A). Mean daily air temperatures in November 2019 were −1.8°C and in 2020 were −3.9°C. In both years the soil temperatures remained at or just below 0°C until snow disappearance in late May or early June. In 2019 the ground froze before wetting-up and remained at about a 12% lower soil moisture through the winter season compared to WY 2021. Marking the onset of snowmelt, the soil moisture began to increase 6 days after peak SWE in WY 2020 and 6 days earlier than peak SWE in WY 2021. The soil temperature on peak SWE in WY 2020 was <0°C while it was 0°C in WY 2021. In both years, as the snow melted the soil moisture increased to a peak near 33%. Peak soil moisture occurred on 2020-04-30 and 2021-05-31. The soil moisture remained near the peak until snow disappearance and dropped near 2020-06-22 and 2021-06-02.
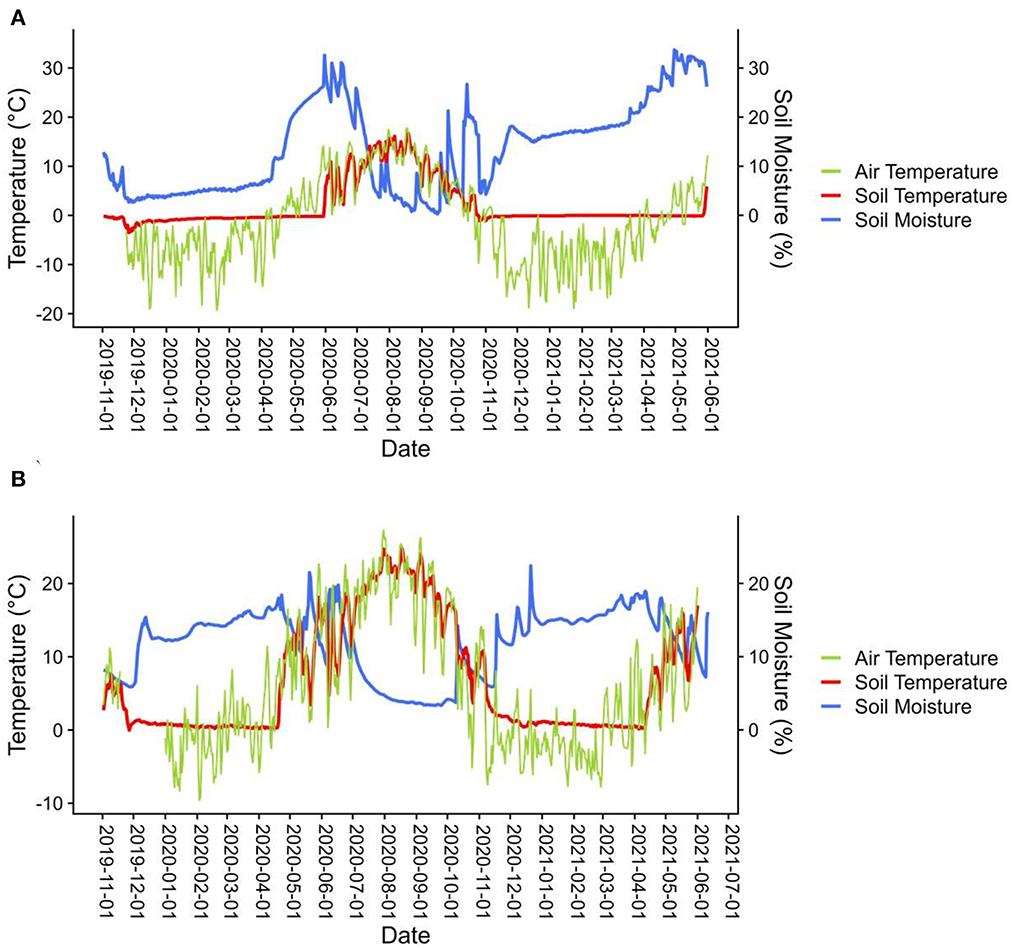
Figure 7. Daily average soil moisture, soil temperature and air temperature in open canopy cover at the SNOTEL located near the BT study location (A) and at the LDP weather station (B). Note the axis limits are different between the two panels.
At the LDP location, mean daily November soil temperatures were 4.04°C in 2019 and 4.07°C in 2020 (Figure 7B). During both snow covered seasons (DJFMA), soil temperature remained above zero and increased sharply as the snow melted in April. During the fall the soil moisture increased and remained at about 15% soil moisture through the winter season. The soil moisture began to increase on 2020-03-01 and 2021-03-04 indicating the onset of the snowmelt period. As the snow melted, the soil moisture increased to a peak near 20%. Peak soil moisture occurred on 2020-05-20 and 2021-04-11.
Snow pits
Including all years, sites and pits, cold content was negatively correlated with snow depth, decreasing as snow depth increased (R2 = 0.60; p < 0.001) (Figure 8). Comparing the individual sites, the slope of Ecc vs. snow depth was greater at the SNOTEL pit site near BT and for greater snow depths (Table 4). For snow depths <60 cm the Ecc tends to be <-0.5 W/m2 except for two early season snow pits at the SNOTEL pit site near BT. Above 60 cm snow depth, the cold content decreased by −3.3 W/m2 per 10 cm increase in snow depth (increase by −3.3 W/m2 per 10 cm decrease in snow depth) through the snow pit measurement periods.
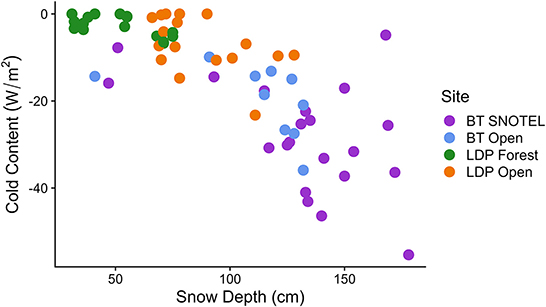
Figure 8. Snowpack cold content versus snow depth for each snow pit and site for WY2020 and WY2021. There were two snow pits at each location (BT and LDP).
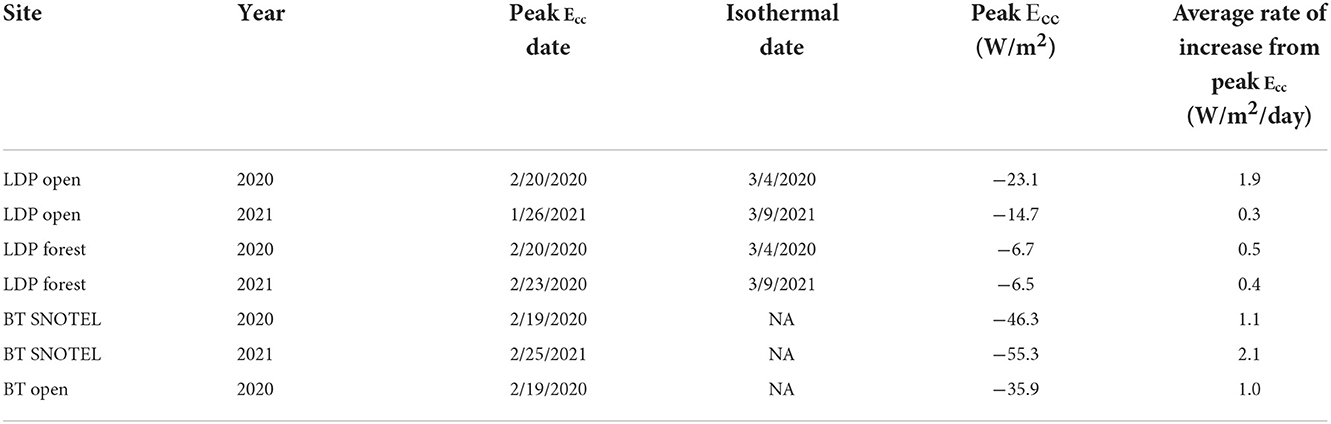
Table 4. Cold content (Ecc) timing and rate of increase towards isothermal at the LDP and BT snow pit sites for 2020 and 2021.
Peak snowpack cold content, Ecc, occurred 6 days earlier in WY 2020 compared to WY 2021 at the SNOTEL pit site near BT (Table 4, Figure 9A). However, peak Ecc was correlated with snow depth and the peak snow depth occurred after snow pits were completed for WY 2020. Peak Ecc was 10.4 W/m2 greater magnitude at the SNOTEL compared to the open site in WY 2020 and 9 W/m2 greater magnitude in WY 2021. The rate of increase from the peak Ecc to 0°C was 1.1 W/m2/day faster in WY 2021. Compared to the LDP location, the peak Ecc near BT was 12.8–48.8 W/m2 greater.
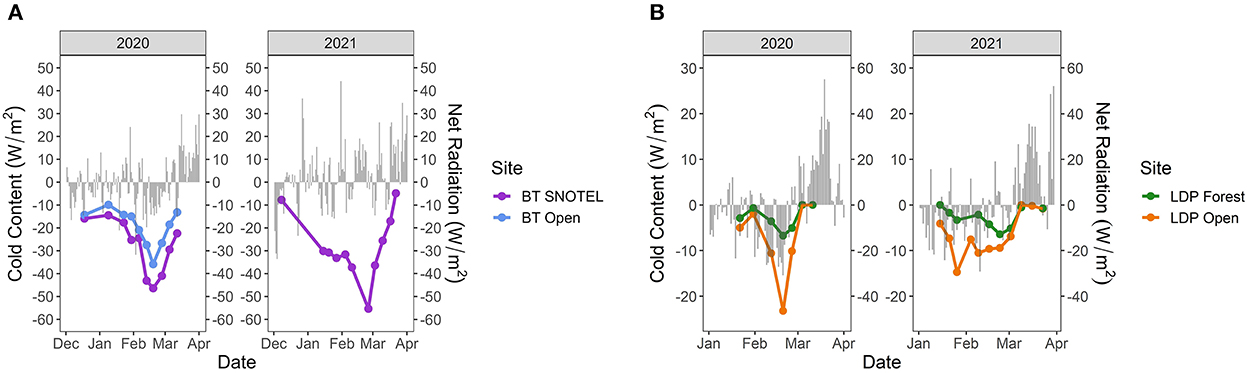
Figure 9. Snowpack cold content at the BT pit sites (A) and LDP pit sites (B) with net total radiation at each site.
At the LDP location peak snowpack cold content occurred at the same time in the open and forest site in WY 2021 and earlier in the open site compared to the forested site in WY 2020 (Figure 9B). Peak cold content occurred within the same week in the forest in WY 2020 and WY 2021 and 25 days earlier at the open site in WY 2021. The peak Ecc was greater magnitude in the open site in both years with WY 2020 having the highest magnitude peak Ecc at the LDP location (8.4 W/m2 greater in WY 2020 than WY 2021). The dates the snowpack became isothermal were the same for both the forest and open sites and within the same week in WY 2020 and WY 2021. In WY 2020, the rate of increase from peak Ecc to isothermal was at least 1.6 W/m2/day greater in the open site compared to WY 2021.
Discussion
Snow accumulation period: Controlled by forest canopy interception
At both locations, less snow accumulated in the forest compared to the open. Similar to Dickerson-Lange et al. (2017), we hypothesize that interception causes this difference in peak snow accumulation. During the accumulation season, the dominant energy balance component in the forest was incoming longwave radiation while the dominant energy balance component in the open was incoming shortwave radiation. Measured incoming longwave radiation at the snow surface was consistent between years and between forest covers (forest, west edge, open) at the LDP location. Incoming shortwave radiation was more variable than incoming longwave radiation between years and forest covers but was lower compared to the longwave radiation for all forest covers. The net energy at the weather stations in the open during the accumulation period tended to be negative or near zero at both locations (BT and LDP) (Figure 10). The low net energy input in the open and low incoming radiation in the forest during the accumulation period suggests that snow interception processes are a first-order process contributing to mass balance differences in different vegetation covers. However, net total radiation was only measured in the open and is likely different in different vegetation covers. The forested site likely had greater daily net longwave radiation compared to the open site and lower net shortwave radiation as indicated by the incoming radiometer measurements at LDP. The snow surface energy differences are likely a second-order process during the accumulation phase.
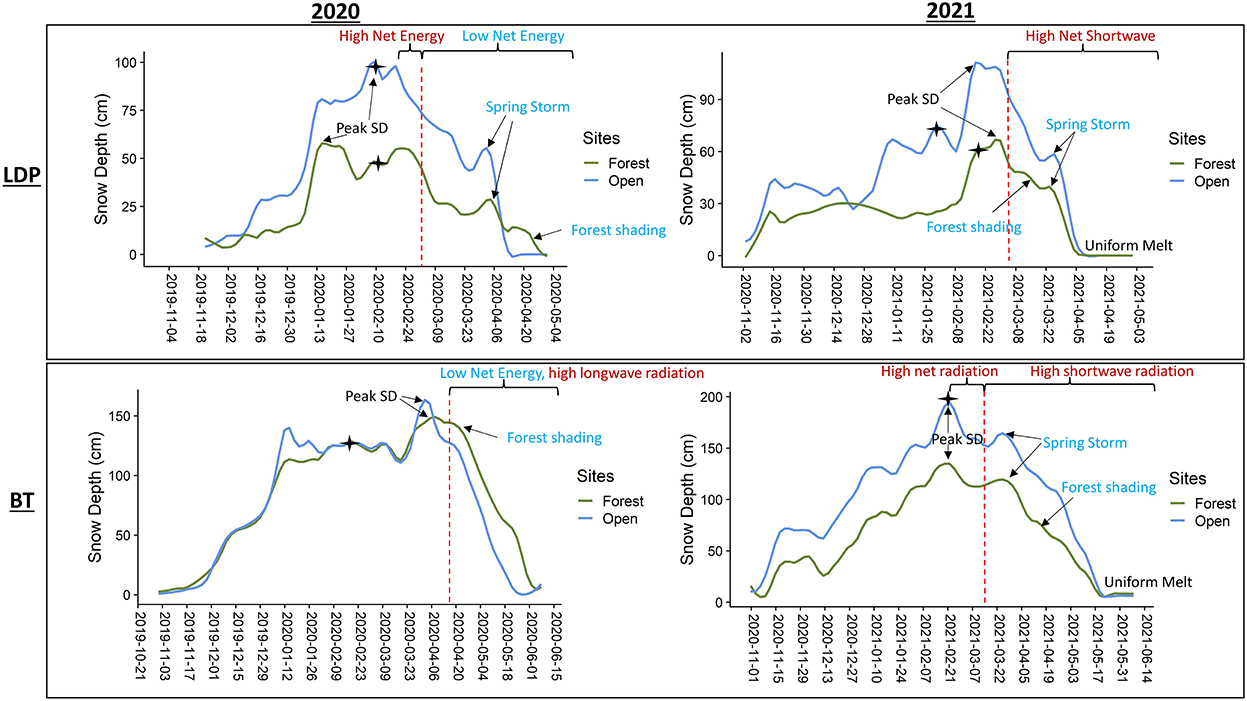
Figure 10. Annotated, loess-smoothed snow depth at the forest and open sites at both study locations and years. The red dotted line represents the start of snowmelt infiltrating the soil profile. The black stars are the timing of the peak Ecc during the snow pit data collection periods. Variables that slow the snowmelt rate and lead to later snow disappearance are in blue while variables that increase the snowmelt rate and lead to earlier snow disappearance are in red. Net energy is the net energy flux defined in Equation 3.
The greater incoming longwave radiation compared to the open site contributed to a greater cold content in the forest compared to the open site at LDP. The greater cold content and lower snow depth in the forested sites resulted in less energy and mass required to reach an isothermal state and initiate the snowmelt period. Both open and forest sites reached isothermal states and the start of the melt period was within the same week. Increased shortwave radiation and therefore net total radiation, increased the cold content in the open at a faster rate, resulting in similar timing of isothermal states in the open and forest. At the end of the accumulation period, both the snowpacks were in isothermal states, thus, the primary difference between the forest and open snowpacks was the mass of snow.
The seasonal snowpack (BT) location reached lower cold content than the marginal snowpack (LDP) location. This is expected considering the seasonal snowpack location is colder and has a deeper snowpack. Comparing the relationship between Ecc and snow depth at each location we observed a steeper slope between snow depth and cold content in the colder location. The steeper slope indicates a greater change in cold content per unit of snow depth. Similar to Jennings and Molotch (2020), this suggests that in warmer, lower snow accumulation sites the contribution of snowfall to Ecc was less compared to colder climates.
Snowmelt period: Controlled by forest shading and spring storms
The snowmelt period established whether the snow disappeared later in the forest or relatively uniformly between vegetation covers. Incoming longwave radiation was the dominant contributor to snowmelt in the forest. However, the greater longwave radiation in the forest did not offset the lower incoming shortwave radiation compared to the open site. Rather, the forest site shaded the snow surface, reducing the incoming shortwave radiation, resulting in a slower snowmelt rate in the forest compared to the open (Figure 10). The slower snowmelt rates in the forest sites combined with less snow mass to melt resulted in a similar snow disappearance timing as the open sites. The edges and sparse vegetation sites melted at a slower rate compared to the open but a faster rate compared to the forest. Similarly, the slower snowmelt rate combined with the lower snow depth resulted in a uniform melt timing with the open and forest sites.
A spring storm offset the snow depths and snow surface energy in the different vegetation covers resulting in a difference in snow disappearance timing between the open and forested sites. For instance, the spring storm in WY 2020 paused the melt at the LDP location by 10 days and resulted in greater snow accumulation in the open site compared to the forest site. The spring storm was likely warm resulting in canopy intercepted snow melting and dripping off the canopy rather than accumulating and sublimating (Storck et al., 2002) expanding the difference in snow depth between the open and forest before snow disappearance. However, we did not measure snow interception but assumed the difference in snow accumulation between the open and forest was due to forest interception. Despite the lower snow accumulation in the forest sites, the relatively low forest canopy density shaded the snow surface, slowing the melt rate following the storm and resulting in later snow disappearance in the forest compared to the open (Sicart et al., 2004; Musselman et al., 2008). The spring storm in WY 2021 also paused snowmelt but for only 3 days and accumulated less snow compared to WY 2020 spring storm. The short duration and lower accumulation storm was not enough to establish a difference in snow disappearance timing between the forest and open sites. Similarly, at the BT location, a late peak snow depth attributed to spring storms set a difference in accumulation between the open and forest sites at the onset of an isothermal state snowpack and the start of the snowmelt period. The slower snowmelt rate in the forest due to forest shading compared to the open and the difference in storm accumulation late in the winter season led to variability in melt timing across vegetation covers.
The behavior of the late peak snow depth was not the same for the marginal snowpack (LDP) and seasonal snowpack (BT) locations. The BT location had more snow to melt and a longer melt period. The higher elevation BT location had lower net total radiation in April compared to LDP. Although we did not measure radiation in the forest at BT, the lower net shortwave radiation and colder temperatures likely resulted in a lower net longwave component at BT compared to the LDP location. The lower net total radiation in the forest and open at BT, combined with a greater snow depth led to a later start of the snowmelt period compared to LDP. The longer melt period in WY 2021 allowed the snow depth at the forest and open sites to reach similar snow depths at the end of the spring and snow disappeared uniformly. In WY 2020 the melt period was shorter and the shading effect of the trees slowed the melt rate compared to the open delaying the snow disappearance date. Conversely, at the LDP location, the late snow depth peak resulted in a uniform snow disappearance. The high net shortwave radiation in WY 2021 resulted in rapid melt following the snow depth peak and less variability between the snow depths in the different vegetation covers in mid-March. Since there is less snow to melt at the LDP location, the forested snow depth was able to catch up to the open snow depth near the snow disappearance timing.
These results support previous research hypothesizing where and why snow melts later in the forest compared to the open. Previously, Lundquist et al. (2013) set a −1°C mean December–January–February air temperature threshold where forest cover shifts from the dominant effect of shading to longwave radiation. Additionally, Dickerson-Lange et al. (2021) flow chart hypothesized that for cold environments forests act to shade the snow cover, slowing snowmelt in the forest and setting up a longer snow cover season in forested environments. Here, both study locations mean December-January-February air temperatures were below the −1°C threshold classifying both locations as cold environments according to the Dickerson-Lange et al. (2021) flow chart. Our results corroborate the previously hypothesized role of shading on snowmelt rates in these cold environments.
Soil moisture and temperature
Similar to other studies we found soil moisture peaked immediately following snow disappearance (Molotch et al., 2009; Smith et al., 2011). At the BT location, the soil froze before the snow cover season and through the accumulation season, the soil temperature increased. As the snow began to melt the soil moisture increased, reaching a similar saturation level as the 2021 season. Regardless of the soil moisture state at the start of winter, we observe a similar moisture level at the beginning of the snow-free season. At the LDP location, soil temperatures remained near or above zero through the winter snow cover season. This result contradicts (Molotch et al., 2009) who found colder soils at the warmer site.
More uniform snow disappearance in different vegetation covers has consequences for the uniformity of peak soil moisture. Since the soil moisture peak coincides with the snow disappearance date, less spatiotemporal variability in snow disappearance timing will cause less spatiotemporal variability in peak soil moisture and soil moisture availability into the summer season. Reduced snow water storage from snowmelt variability could extend the period when soil is dry and the length of vegetation water stress into the summer season (Harpold, 2016).
Uncertainties and assumptions
Uncertainties due to meteorological data and field measurements are present. The incoming shortwave and longwave radiometers at LDP were not heated and thus required snow to melt off them or to be cleaned off following snowfall. Because of this, we removed incoming radiation data during snow storms which may result in higher shortwave radiation and lower longwave radiation measurements. However, when comparing the open radiometer measurements to the heated radiometer at the weather station we did not observe a significant difference in the range of measurements. Additionally, the radiometers were installed on poles ranging from 1 to 1.5 m off the ground surface. The height of the radiometers did not change throughout the snow season thus, we assumed the incoming radiation 1–1.5 m above the surface was the same as the incoming radiation on the snow surface. Additionally, Maxbotix snow depth sensors have a 1 mm resolution and do not work when the sensor height is between 30 and 50 cm. To avoid the no data range we installed the snow depth sensors at least 2 m above the ground. At each snow depth sensor, we are not able to account for the changes in snow depth due to densification (i.e., settling and metamorphism) thus are focused on changes in snow depth.
The ground heat flux energy balance calculation used soil data from the SNOTEL site 2 km away. The climate conditions between the SNOTEL and the weather station at BT did not vary greatly, thus we assumed the ground temperature and moisture were similar at the BT location. The turbulent fluxes were calculated using the weather station data. We did not measure relative humidity at the snow surface which could result in an overestimate of latent heat at the surface. However, a sensitivity analysis adjusting the relative humidity by ±5% did not greatly change the latent heat flux. Additionally, the results of this study are based on 2 years of field data at nine points in southern Idaho. While these points are representative of the dominant vegetation type and climate in the region, the points may not imitate the heterogenous landscape in the region.
Conclusion
Forests can enhance snowmelt rates via longwave radiation and reduce snowmelt rates by shading the snow surface from shortwave radiation (Varhola et al., 2010). These energy balance processes can cancel each other out, but changes to the forest structure from landcover changes such as fire and bark beetle will alter the dominant forest energy balance process. We find that shading suppresses the effect of shortwave radiation in relatively low-density forests, increasing the snow duration in the forest. However, snowpack cold content is greater in forested areas than in open areas, requiring less energy to bring the snowpack to an isothermal state, which partially cancels the shading effect. At the seasonal snowpack (BT) location, the magnitude and timing of the snow depth peak were important for predicting the variability of snowmelt. The marginal snowpack (LDP) location was controlled by the magnitude and duration of a late season storm adding snow depth variability and reducing the snow surface energy input. At both sites, the forests shade the snow surface into the melt period.
The results of this study have broader implications for the effects of forest cover on snow persistence and water availability in semi-arid regions. These results support the decision tree framework to understand how vegetation influences snow distribution (Dickerson-Lange et al., 2021). Developing an understanding of the dominant controls on snowmelt across the region is applicable for forecasting the timing and quantity of snow water availability for environmental and societal water and forest management. These results will support practitioners by having a baseline understanding of dominant controls on snow water availability. Landcover change due to gap thinning or forest fire will likely increase the snowmelt rates in the forest site. However, in relatively low density forests, standing dead trees potentially still attenuate incoming shortwave radiation (Burles and Boon, 2011). Similarly, gap thinning will increase the amount of total radiation at the snow surface increasing snowmelt rates (Seyednasrollah et al., 2013). These results presented here provide regionally specific observations to support resource management in a changing climate and environment. Future research will focus on the larger scale analysis to identify how landcover changes will affect the snow distribution. Such an analysis will support how the controls on snow distribution will change due to landcover changes such as fire, bark beetle, and vegetation succession.
Data availability statement
The datasets presented in this study can be found in online repositories. The names of the repository/repositories and accession number(s) can be found below: https://www.boisestate.edu/drycreek/dry-creek-data/; https://nsidc.org/data/snowex/data_summaries; https://www.hydroshare.org/resource/39cf58935f944f10b98baad07368449d/.
Author contributions
All authors listed have made a substantial, direct, and intellectual contribution to the work and approved it for publication.
Funding
Fellowship funding was provided by the National Science Foundation Hydrologic Sciences Program Award Number 1914598 and by the NASA Idaho Space Grant Consortium. Instrument maintenance and data courtesy of Dry Creek Experimental Watershed and the Department of Geosciences at Boise State University.
Acknowledgments
This research was conducted as part of the NASA SNOWEX project. We thank Dr. Tim Link for loaning us the shortwave and longwave radiometer arrays. Additionally, the authors thank Dan Murray, Thomas Otheim, Monica Vermillion, Josh Morell, Megan Mason, and Dr. Will Rudisill for their assistance in the field.
Conflict of interest
The authors declare that the research was conducted in the absence of any commercial or financial relationships that could be construed as a potential conflict of interest.
Publisher's note
All claims expressed in this article are solely those of the authors and do not necessarily represent those of their affiliated organizations, or those of the publisher, the editors and the reviewers. Any product that may be evaluated in this article, or claim that may be made by its manufacturer, is not guaranteed or endorsed by the publisher.
References
Anderson, B. T., McNamara, J. P., Marshall, H. P., and Flores, A. N. (2014). Insights into the physical processes controlling correlations between snow distribution and terrain properties. Water Resour. Res. 50, 5375–5377. doi: 10.1002/2013WR013714
Andreadis, K. M., Storck, P., and Lettenmaier, D. P. (2009). Modeling snow accumulation and ablation processes in forested environments. Water Resour. Res. 45, 7042. doi: 10.1029/2008WR007042
Badger, A. M., Bjarke, N., Molotch, N. P., and Livneh, B. (2021). The sensitivity of runoff generation to spatial snowpack uniformity in an alpine watershed: Green Lakes Valley, Niwot Ridge Long Term Ecological Research Station. Hydrol. Process. 35, e14331. doi: 10.1002/hyp.14331
Bilish, S., Callow, J., McGrath, G., and McGowan, H. (2019). Spatial controls on the distribution and dynamics of a marginal snowpack in the Australian Alps. Hydrol. Process. 33, 1739–1755. doi: 10.1002/hyp.13435
Brown, T. C., Hobbins, M. T., and Ramirez, J. A. (2008). Spatial distribution of water supply in the conterminous United States. J. Am. Water Resour. Assoc. (JAWRA) 44, 1474–1487. doi: 10.1111/j.1752-1688.2008.00252.x
Broxton, P. D., Harpold, A. A., Biederman, J. A., Troch, P. A., Molotch, N. P., Brooks, P. D., et al. (2015). Quantifying the effects of vegetation structure on snow accumulation and ablation in mixed-conifer forests. Ecohydrology 8, 1073–1094. doi: 10.1002/eco.1565
Broxton, P. D., Moeser, C. D., and Harpold, A. (2021). Accounting for fine-scale forest structure is necessary to model snowpack mass and energy budgets in montane forests. Water Resour. Res. 57, e2021WR029716. doi: 10.1029/2021WR029716
Burles, K., and Boon, S. (2011). Snowmelt energy balance in a burned forest plot, Crowsnest Pass, Alberta, Canada. Hydrol. Process. 25, 3012–3029. doi: 10.1002/hyp.8067
Currier, W. R., and Lundquist, J. D. (2018). Snow depth variability at the forest edge in multiple climates in the western United States. Water Resour. Res. 54, 8756–8773. doi: 10.1029/2018WR022553
DeBeer, C. M., and Pomeroy, J. W. (2017). Influence of snowpack and melt energy heterogeneity on snow cover depletion and snowmelt runoff simulation in a cold mountain environment. J. Hydrol. 553, 199–213. doi: 10.1016/j.jhydrol.2017.07.051
Dickerson-Lange, S. E., Gersonde, R. F., Hubbart, J. A., Link, T. E., Nolin, A. W., Perry, G. H., et al. (2017). Snow disappearance timing is dominated by forest effects on snow accumulation in warm winter climates of the Pacific Northwest, United States. Hydrol. Process. 31, 1846–1862. doi: 10.1002/hyp.11144
Dickerson-Lange, S. E., Lutz, J. A., Gersonde, R., Martin, K. A., Forsyth, J. E., Lundquist, J. D., et al. (2015). Observations of distributed snow depth and snow duration within diverse forest structures in a maritime mountain watershed. Water Resour. Res. 51, 9353–9366. doi: 10.1002/2015WR017873
Dickerson-Lange, S. E., Vano, J. A., Gersonde, R., and Lundquist, J. D. (2021). Ranking forest effects on snow storage: a decision tool for forest management. Water Resour. Res. 57, e2020WR027926. doi: 10.1029/2020WR027926
ESRI (2017). World Imagery: Basemap. Available online at: https://services.arcgisonline.com/ArcGIS/rest/services/World_Imagery/MapServer (accessed February 2, 2022).
Fang, X., and Pomeroy, J. W. (2016). Impact of antecedent conditions on simulations of a flood in a mountain headwater basin. Hydrol. Process. 30, 2754–2772. doi: 10.1002/hyp.10910
Geroy, I. J., Gribb, M. M., Marshall, H. P., Chandler, D. G., Benner, S. G., McNamara, J. P., et al. (2011). Aspect influences on soil water retention and storage. Hydrol. Process. 25, 3836–3842. doi: 10.1002/hyp.8281
Gray, D. M., and Male, D. H. (1981). Handbook of Snow: Principles, Processes, Management and Use. Caldwell, NJ: Blackburn Press.
Haleakala, K., Gebremichael, M., Dozier, J., and Lettenmaier, D. P. (2021). Factors governing winter snow accumulation and ablation susceptibility across the Sierra Nevada, U.S.A. J. Hydrometeorol. 22, 1455–1472. doi: 10.1175/JHM-D-20-0257.1
Hammond, J. C., Harpold, A. A., Weiss, S., and Kampf, S. K. (2019). Partitioning snowmelt and rainfall in the critical zone: effects of climate type and soil properties. Hydrol. Earth Syst. Sci. 23, 3553–3570. doi: 10.5194/hess-23-3553-2019
Hammond, J. C., Saavedra, F. A., and Kampf, S. K. (2018). How does snow persistence relate to annual streamflow in mountain watersheds of the Western U.S. with wet maritime and dry continental climates? Water Resour. Res. 54, 2605–2623. doi: 10.1002/2017WR021899
Hardy, J. P., Melloh, R., Koenig, G., Marks, D., Winstral, A., Pomeroy, J. W., et al. (2004). Solar radiation transmission through conifer canopies. Agric. For. Meteorol. 126, 257–270. doi: 10.1016/j.agrformet.2004.06.012
Harpold, A. A. (2016). Diverging sensitivity of soil water stress to changing snowmelt timing in the Western U.S. Adv. Water Resour. 92, 116–129. doi: 10.1016/j.advwatres.2016.03.017
Havens, S., Marks, D., FitzGerald, K., Masarik, M., Flores, A. N., Kormos, P., and Hedrick, A. (2019). Approximating input data to a snowmelt model using weather research and forecasting model outputs in lieu of meteorological measurements. J. Hydrometeorol. 20, 847–862. doi: 10.1175/JHM-D-18-0146.1
Hojatimalekshah, A., Uhlmann, Z., Glenn, N., Hiemstra, C., Tennant, C., Graham, J., et al. (2020). Tree canopy and snow depth relationships at fine scales with terrestrial laser scanning. Cryosphere Discuss. 2020, 1–35. doi: 10.5194/tc-2020-277
Honjo, T., Lin, T. P., and Seo, Y. (2019). Sky view factor measurement by using a spherical camera. J. Agric. Meteorol. 75, 59–66. doi: 10.2480/agrmet.D-18-00027
Hubbart, J. A., Link, T. E., and Gravelle, J. A. (2015). Forest canopy reduction and snowpack dynamics in a Northern Idaho watershed of the continental-maritime region, United States. For. Sci. 61, 882–894. doi: 10.5849/forsci.14-025
Jennings, K. S., Kittel, T. G. F., and Molotch, N. P. (2018). Observations and simulations of the seasonal evolution of snowpack cold content and its relation to snowmelt and the snowpack energy budget. Cryosphere 12, 1595–1614. doi: 10.5194/tc-12-1595-2018
Jennings, K. S., and Molotch, N. P. (2020). Snowfall fraction, cold content, and energy balance changes drive differential response to simulated warming in an alpine and subalpine snowpack. Front. Earth Sci. 8, e186. doi: 10.3389/feart.2020.00186
Kelleners, T. J., Chandler, D. G., McNamara, J. P., Gribb, M. M., and Seyfried, M. S. (2010). Modeling runoff generation in a small snow-dominated mountainous catchment. Vadose Zone J. 9, 517–527. doi: 10.2136/vzj2009.0033
Kormos, P. R., Marks, D., McNamara, J. P., Marshall, H. P., Winstral, A., Flores, A. N., et al. (2014). Snow distribution, melt and surface water inputs to the soil in the mountain rain-snow transition zone. J. Hydrol. 519, 190–204. doi: 10.1016/j.jhydrol.2014.06.051
Koutantou, K., Mazzotti, G., Brunner, P., Webster, C., and Jonas, T. (2022). Exploring snow distribution dynamics in steep forested slopes with UAV-borne LiDAR Cold Regions Science and Technology Exploring snow distribution dynamics in steep forested slopes with UAV-borne LiDAR. Cold Regions Sci. Technol. 200, 103587. doi: 10.1016/j.coldregions.2022.103587
Kraft, M., and McNamara, J. P. (2022). Evapotranspiration across the rain-snow transition in a semi-arid watershed. Hydrol. Process. 36, e14519. doi: 10.1002/hyp.14519
Lawler, R. R., and Link, T. E. (2011). Quantification of incoming all-wave radiation in discontinuous forest canopies with application to snowmelt prediction. Hydrol. Process. 25, 3322–3331. doi: 10.1002/hyp.8150
Lopez-Moreno, J. I., Gascoin, S., Herrero, J., Sproles, E. A., Pons, M., Alonso-González, E., et al. (2017). Different sensitivities of snowpacks to warming in Mediterranean climate mountain areas. Environ. Res. Lett. 12, e074006. doi: 10.1088/1748-9326/aa70cb
Lundquist, J. D., Dickerson-Lange, S. E., Lutz, J. A., and Cristea, N. (2013). Lower forest density enhances snow retention in regions with warmer winters: a global framework developed from plot-scale observations and modeling. Water Resour. Res. 49, 6356–6370. doi: 10.1002/wrcr.20504
Malle, J., Rutter, N., Webster, C., Mazzotti, G., Wake, L., Jonas, T., et al. (2021). Effect of forest canopy structure on wintertime Land Surface Albedo: evaluating CLM5 simulations with in-situ measurements. J. Geophys. Res. Atmos. 126, 1–15. doi: 10.5194/egusphere-egu2020-16017
Marks, D., Kimball, J., Tingey, D., and Link, T. E. (1998). The sensitivity of snowmelt processes to climate conditions and forest cover during rain-on-snow: a case study of the 1996 Pacific Northwest flood. Hydrol. Process. 12, 1569–1587. doi: 10.1002/(SICI)1099-1085(199808/09)12:10/11<1569::AID-HYP682>3.0.CO;2-L
Marks, D., Link, T. E., Winstral, A., and Garen, D. (2001). Simulating snowmelt processes during rain-on-snow over a semi-arid mountain basin. Ann. Glaciol. 32, 195–202. doi: 10.3189/172756401781819751
Marks, D., and Winstral, A. (2001). Comparison of snow deposition, the snow cover energy balance, and snowmelt at two sites in a Semiarid Mountain Basin. J. Hydrometeorol. 2, 213–227. doi: 10.1175/1525-7541(2001)002<0213:COSDTS>2.0.CO;2
Marshall, H. P., Vuyovich, C., Hiemstra, C. A., Brucker, L., Elder, K., Deems, J. S., et al. (2019). NASA SNOWEX 2020 Experiment Plan.
Mazzotti, G., Currier, W. R., Deems, J. S., Pflug, J. M., Lundquist, J. D., Jonas, T., et al. (2019). Revisiting snow cover variability and canopy structure within forest stands: insights from airborne lidar data. Water Resour. Res. 55, 6198–6216. doi: 10.1029/2019WR024898
Milly, P. C. D., and Dunne, K. A. (2020). Colorado River flow dwindles as warming-driven loss of reflective snow energizes evaporation. Science. 367, 1252–1255. doi: 10.1126/science.aay9187
Moeser, D., Roubinek, J., Schleppi, P., Morsdorf, F., and Jonas, T. (2014). Canopy closure, LAI and radiation transfer from airborne LiDAR synthetic images. Agric. For. Meteorol. 197, 158–168. doi: 10.1016/j.agrformet.2014.06.008
Molotch, N., Brooks, P., Burns, S. P., Litvak, M. E., Monson, R. K., McConnell, J. R., et al. (2009). Ecohydrology controls on snowmelt partitioning in mixed-conifer sub-alpine forests. Ecohydrology 2, 129–142. doi: 10.1002/eco.48
Morris, E. M. (1989). Turbulent transfer over snow and ice. J. Hydrol. 105, 205–223. doi: 10.1016/0022-1694(89)90105-4
Musselman, K., Vano, J., and Molotch, N. (2021). Melt trends portend widespread declines in snow water resources. Nat. Clim. Chang. 11, 418–424. doi: 10.1038/s41558-021-01014-9
Musselman, K. N., Molotch, N. P., and Brooks, P. D. (2008). Effects of vegetation on snow accumulation and ablation in a mid-latitude sub alpine forest. Hydrol. Process. 22, 2767–2776. doi: 10.1002/hyp.7050
Pomeroy, J. W., Marks, D., Link, T. E., Ellis, C., Hardy, J., Rowlands, A. A., et al. (2009). The Impact of coniferous forest temperature on incoming longwave radiation to melting snow. Hydrol. Process. 23(May), 2513–2525. doi: 10.1002/hyp.7325
Poulos, M. J., Smith, T. J., Benner, S. G., Pierce, J. L., Flores, A. N., Seyfried, M. S., et al. (2021). Topographically moderated soil water seasons impact vegetation dynamics in semiarid mountain catchments: illustrations from the dry creek experimental watershed, Idaho, USA. Hydrol. Process. 35, e14421. doi: 10.1002/hyp.14421
Rice, R., Bales, R. C., Painter, T. H., and Dozier, J. (2011). Snow water equivalent along elevation gradients in the Merced and Tuolumne River basins of the Sierra Nevada. Water Resour. Res. 47, 1–11. doi: 10.1029/2010WR009278
Roth, T. R., and Nolin, A. W. (2017). Forest impacts on snow accumulation and ablation across an elevation gradient in a temperate montane environment. Hydrol. Earth System Sci. 21, 5427–5442. doi: 10.5194/hess-21-5427-2017
Roth, T. R., and Nolin, A. W. (2019). Characterizing maritime snow canopy interception in forested mountains. Water Resour. Res. 55, 4564–4581. doi: 10.1029/2018WR024089
Safa, H., Krogh, S. A., Greenberg, J., Kostadinov, T. S., and Harpold, A. A. (2021). Unraveling the controls on snow disappearance in Montane Conifer forests using multi-site lidar. Water Resour. Res. 2021, 1–20. doi: 10.1002/essoar.10502562.1
Schleppi, P., Conedera, M., Sedivy, I., and Thimonier, A. (2007). Correcting non-linearity and slope effects in the estimation of the leaf area index of forests from hemispherical photographs. Agric. For. Meteorol. 144, 236–242. doi: 10.1016/j.agrformet.2007.02.004
Seyednasrollah, B., and Kumar, M. (2014). Net radiation in a snow-covered discontinuous forest gap for a range of gap sizes and topographic configurations. J. Geophys. Res. 119, 10323–10342. doi: 10.1002/2014JD021809
Seyednasrollah, B., Kumar, M., and Link, T. E. (2013). On the role of vegetation density on net snow cover radiation at the forest floor. J. Geophys. Res. Atmos. 118, 8359–8374. doi: 10.1002/jgrd.50575
Sicart, J. E., Essery, R. L. H., Pomeroy, J. W., Hardy, J., Link, T., Marks, D., et al. (2004). A Sensitivity study of daytime net radiation during snowmelt to forest canopy and atmospheric conditions. J. Hydrometeorol. 5, 774–784. doi: 10.1175/1525-7541(2004)005<0774:ASSODN>2.0.CO;2
Smith, T. J. J., McNamara, J. P., Flores, A. N., Gribb, M. M., Aishlin, P. S., Benner, S. G., et al. (2011). Small soil storage capacity limits benefit of winter snowpack to upland vegetation. Hydrol. Process. 25, 3858–3865. doi: 10.1002/hyp.8340
Soil-Survey-Staff (2013). US General Soil Map. USDA Natural Resources Conservation Service. Available online at: http://websoilsurvey.nrcs.usda.gov/app/WebSoilSurvey.aspx (accessed January 1, 2022).
Storck, P., Lettenmaier, D. P., and Bolton, S. M. (2002). Measurement of snow interception and canopy effects on snow accumulation and melt in a mountainous maritime climate, Oregon, United States. Water Resour. Res. 38, 5-1–5-16. doi: 10.1029/2002WR001281
Varhola, A., Coops, N. C., Weiler, M., and Moore, R. D. (2010). Forest canopy effects on snow accumulation and ablation: an integrative review of empirical results. J. Hydrol. 392, 219–233. doi: 10.1016/j.jhydrol.2010.08.009
Webster, C., Rutter, N., Zahner, F., and Jonas, T. (2016). Measurement of incoming radiation below forest canopies: a comparison of different radiometer configurations. J. Hydrometeorol. 17, 853–864. doi: 10.1175/JHM-D-15-0125.1
Keywords: snowmelt, snow-vegetation interactions, snow accumulation, semi-arid, snow ablation, energy balance
Citation: Kraft M, McNamara JP, Marshall H-P and Glenn NF (2022) Forest impacts on snow accumulation and melt in a semi-arid mountain environment. Front. Water 4:1004123. doi: 10.3389/frwa.2022.1004123
Received: 26 July 2022; Accepted: 14 November 2022;
Published: 29 November 2022.
Edited by:
Nicoleta Cristea, University of Washington, United StatesReviewed by:
Clare Webster, WSL Institute for Snow and Avalanche Research SLF, SwitzerlandFadji Maina, Goddard Space Flight Center (NASA), United States
Susan Dickerson-Lange, Natural Systems Design, United States
Copyright © 2022 Kraft, McNamara, Marshall and Glenn. This is an open-access article distributed under the terms of the Creative Commons Attribution License (CC BY). The use, distribution or reproduction in other forums is permitted, provided the original author(s) and the copyright owner(s) are credited and that the original publication in this journal is cited, in accordance with accepted academic practice. No use, distribution or reproduction is permitted which does not comply with these terms.
*Correspondence: Maggi Kraft, maggikraft@u.boisestate.edu